


Nothing sounds worse to a prospective home buyer than two ominous words: sellers’ market.
The term used to describe a housing market where the ratio of homes sales-to-new listings is higher than 60 percent — often leads buyers to imagine ballooning home prices and wild bidding wars.
But, according to a new report from real estate website Zoocasa, that’s not always the case.
The report analyzed the sales-to-new-listings ratio of housing markets across Ontario, and some of what it found was surprising.
Some of the province’s biggest sellers’ markets are also home to its lowest home prices. Ten of the 12 markets considered sellers’ markets had homes that sold for an average of less than $500,000. Thunder Bay, for instance, has a ratio of 90 percent, but an average home price of just $225,945.
“It’s a pretty common misconception, that when you hear ‘sellers’ market’ you automatically picture steep prices,” Penelope Graham, managing editor of Zoocasa, tells Livabl. “Really it’s just a question of how long it takes for homes that go on the market to sell. In northern communities, there’s often fewer homes on the market, so they sell quickly.”
That’s the case in North Bay, which has a ratio of 88 percent, but an average home price of just $258,597. Similarly, Sault Ste. Marie has a ratio of 86 percent and an average price of $184,028.
But while the sales-to-new listings ratio may not be a good reflection of how affordable a market is, Graham says it is an important metric for both buyers and sellers to consider.
“It provides insights into how a market has changed over the past several months, and about whether it’s the right time to buy or to list, or what your offer strategy should look like,” she explains.
For a closer look into which Ontario markets are most advantageous for sellers’ (and which buyers should keep an eye on), check out Zoocasa’s infographic below.
7 Charts that Explain the Canadian Housing Market’s Autumn Sales Dip
On the heels of a warmer summer, fall has brought an activity cool down to almost every major Canadian housing market.
The reason for the dip in sales and prices varies from city to city, but almost all are dealing with the impact of stricter mortgage qualification rules and higher interest rates.
For a closer look at where the market sits heading into the final stretch of 2018, Livabl has rounded up a series of charts to give you the perspective you need on the current state of affairs.
1. National home sales took a dive

What’s going on here: The Canadian Real Estate Association (CREA) tracked national home sales over the past year.
The takeaway: Sales fell 1.6 percent month-over-month in October, the second consecutive month of cooling activity. CREA notes that, while the market is still stronger than earlier this year, sales are well below year-ago levels.
2. BC sales activity continues to struggle

What’s going on here: The British Columbia Real Estate Board tracked seasonally adjusted sales activity in the province over the past 18 years.
The takeaway: It’s been a rough year for the BC housing market, and October wasn’t much better. Cities are struggling to adjust to stricter mortgage rules, a foreign buyers tax, and rising interest rates.
3. Toronto home sales are stabilizing

What’s going on here: The Toronto Real Estate Board tracked the sales-to-new-listings ratio for the Toronto market over the past three years. A ratio of between 40 to 60 percent is considered balanced, with readings above and below indicating a sellers and buyers market, respectively.
The takeaway: The market remains firmly in balanced territory, with sales falling and listings rising slightly in October. While the market seemed to be inching back into seller’s territory in August, October’s reading shows that that’s unlikely to happen anytime soon.
4. The low-rise market is struggling

What’s going on here: Scotiabank Economics used CREA data to chart the price movement of single-family homes in the BC Lower Mainland, Greater Toronto, Montreal and Calgary areas, over the past three years.
The takeaway: Nearly every market saw a dip in low-rise prices last month, with the exception of Toronto, where prices inched upwards. For months, the low-rise market has struggled, as buyers flock to the relatively more affordable condo market.
5. National actual activity is down

What’s going on here: CREA tracked actual (not seasonally adjusted) activity over the past year.
The takeaway: Activity was down 3.74 percent in October, below year-ago levels but still in line with the 10-year average.
6. Prices also took a hit at the national level

What’s going on here: CREA tracked the actual national average sales price over the last year.
The takeaway: The average price dropped 1.53 percent year-over-year to $496,800, reflecting an overall dampening of activity last month.
7. Even Montreal home prices are levelling off
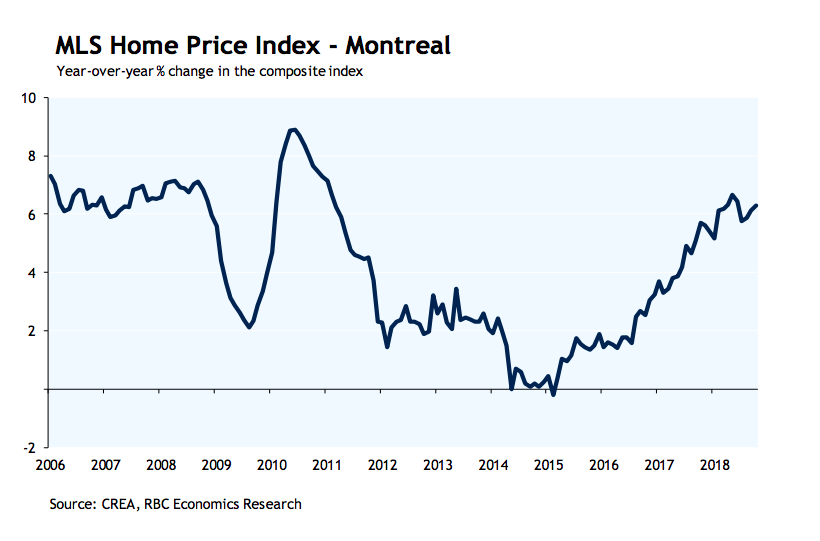
Written by Sarah Niedoba, Livabl